“Time Is a flat circle, everything we’ve ever done or will do, we’re gonna do over and over and over again.” – Rust Cohle (True Detective Series)
This is really just a fancy way of describing cyclicality or having enough time pass so that people can make the same mistakes over again.
50 years have passed since 1970.

Most people were probably in their late twenties or early thirties by the time they were in a position of responsibility, business or job, family, mortgage, etc.
Hence, the ones that remember the pain of inflation in the 1970s are now into their 70s or 80s, most likely retired and not making the decisions anymore.
Here are a few of the parallels I’ve picked up on.
Inflation Expectations
Or, to be more accurate the lack of them.

Central Bankers are so keen to hit their inflationary targets that they will let inflation run hot when it does start to show up.
This was the same set-up as Tony Boeckh experienced in the Canadian Central bank in the 1970s (I recommend you watch it).

“MMT is basically a Keynesian concept.
If you get a little bit of inflation whats the problem was the prevailing attitude (at the central bank of Canada).
Nobody had any experience at the central bank with inflation & were just as caught off guard as the private sector“
-Tony Boeckh
Stephanie Kelton has already gained a lot of traction with her book on MMT.
While I haven’t finished her book yet the one thing that has stood out to me is the MMT proponents’ confidence in understanding how inflation works and how it can be controlled (sounds similar to we’ll just create a little bit of inflation…)
As I read this I was reminded of a Yogi Berra quote:
“In theory there is no difference between theory and practice. In practice there is.“
What do I think these academics are missing?
Well, the possibility of cost-push inflation resulting in stagflation just like the 1970s.
Supply destruction in the commodity sector
The below chart does a fantastic job of illustrating this rotation between financial assets and real assets (just a pity it doesn’t extend to 2020 to show how extreme things have gotten).

Energy represents 62% of the Goldman Sachs commodity index above and is the one topic that is usually left out of the inflation-deflation debate. If it is included, then the argument relies heavily upon renewables/EVs offsetting the energy demand which I don’t buy (check my previous post).
A quick overview of the issue:
We have the shale boom imploding which had filled the gap in conventional oil production for the last decade.
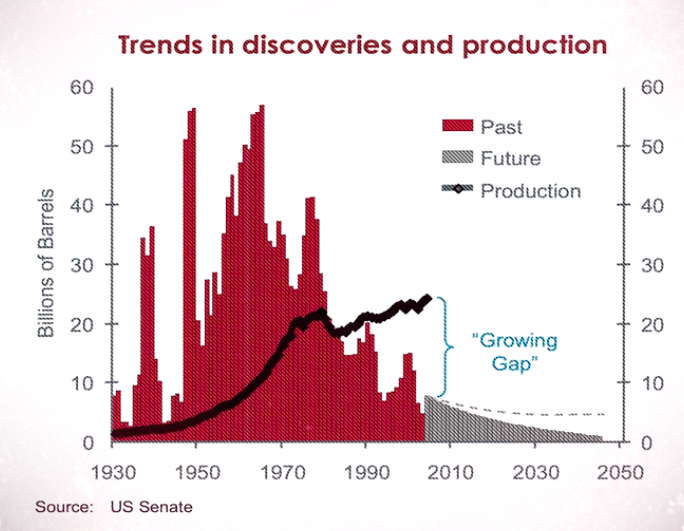
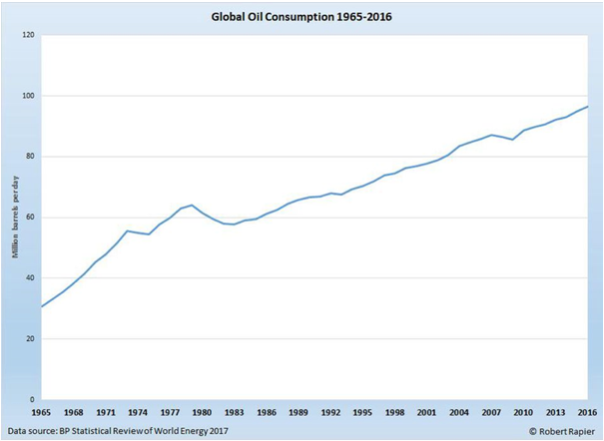
While oil demand has taken a big hit the last few months by all accounts, it is bouncing back quicker than most estimates.
This will come as no surprise if you look back over oil consumption history as it refuses to stay down for long followings crises (just look at 1973 Oil embargo or the Global Financial Crisis).
I struggle to see an energy bull market without significantly higher inflation.
It’s the first question I would ask most of those firmly seated in the deflation camp.
Nifty Fifty Parallels

This article sounds awfully similar to the Nifty Fifty in which the catchphrase went something like this;
“These were blue-chips that had such high growth prospects that no price was too high to pay.“
There was nothing wrong with most of these companies in 1972 apart from the implicit expectations in their valuations departing from reality.

Passive = Systematic active investors at any price
The aha moment for the implication of this came when listening to and reading Mike Green’s blog and podcast (this whole series of podcasts are gold and I can’t recommend them highly enough).
Some simple takeaways:
- If passive money flows are positive then buy at any price.
- If passive money flows are negative then sell at any price.
- Is there any plan for how the likes of Vanguard, Blackrock, etc undertake this selling in a way that won’t mess up markets in a big way?
No.
They’ve only had positive flows for the last 10years.
The indexing works well up to a certain size, but when taken to an extreme like it is currently, some cracks start to show.
Passive flows are actually cornering the float of many of these stocks
I could summarise the below, but I’d be doing you a disservice since this presentation from Horizon Kinetics explains it perfectly (I recommend you to set aside time to watch this since it’s very insightful on not only on indexation but inflation as well).

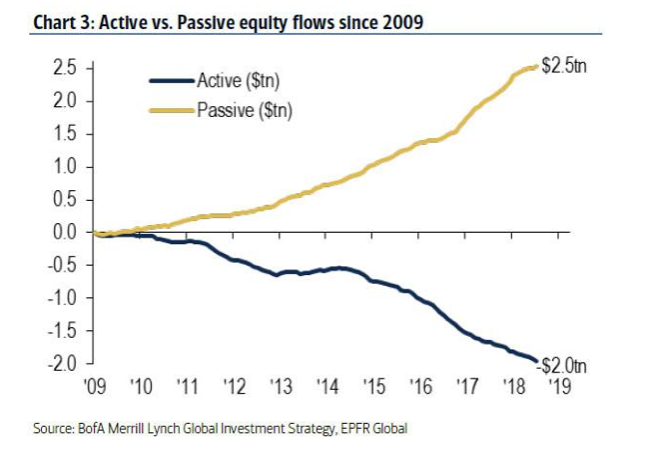
With this new information, the below chart starts to make a lot more sense. The more money flows into passive investments, the higher the passive share and smaller the ‘active’ share of the remainder.
Yet, this begs the question: When this is simply a result of two-thirds of the money (and growing) being driven into this stock, who is going to be there to buy it when they want to sell from these lofty valuations?
For a gross oversimplification for every ~$2 of passive money, there is only ~$1 of active.
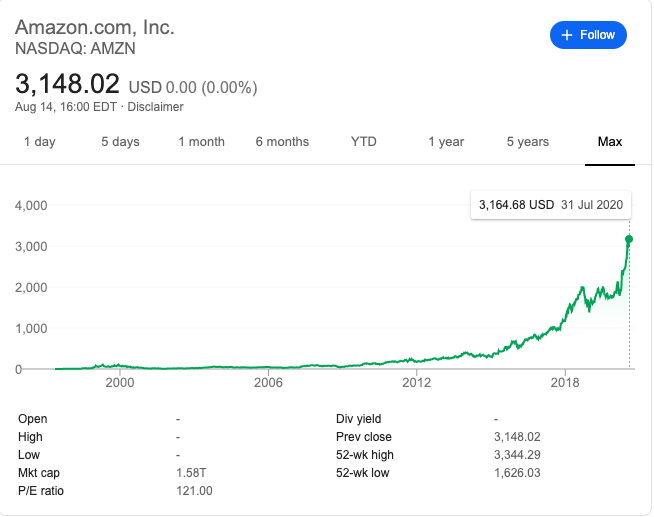
Considering that active managers have been batted for years are they really going to want to put money to work in Amazon stock at ~$3000, when it is likely being sold to rebalance into a sector that is outperforming?
As Mike Green discusses, this could lead to some big gaps in pricing (if passive money flows are negative then sell at any price).
Passive being past the point of being able to rebalance

What the hell happens when you try to rebalance out of the tech sector representing 21% of the S&P into, for example, the energy sector at 3% (yes I’m biased, so I will use energy as the example).
It’s not a stretch of the imagination to see energy weighting return to a historical average (say 15% or greater).

If you don’t see how this could occur then have a read of more post The Next Big Trade or for some people far smarter than I head to Gorozens blog.
It’s easy to forget the big oilers have higher revenues than the tech companies, it’s just their profitability that is screwed at the moment (while Apple, Google and Facebook are running fat profit margins).
What would Shell, BP, Exon, Total’s profit margin look like at $150 a barrel? (granted they don’t destroy their businesses in the interim sell oil assets low and buying renewable assets high).

Let me run through a possible scenario.
The energy sector starts to rally, be it from supply/demand imbalance becoming clear, inflation rearing its end, or any number of reasons.
Their market caps increase, so quarterly rebalance of S&P500 means passive flows buy into tight energy stock floats squeezing them, at the same time the remaining active investors are chasing them.
The obvious outcome of this is that anyone with half a brain will be balls to the wall energy which will mean active will outperform passive.
Especially since the passive performance will be taking a bath on the rebalancing out of technology which will be rapidly repriced (as there won’t be many buyers waiting around to pick up tech at the nosebleed levels passive squeezed it up too).
Undiversifying an Index
The indexes have managed to undiversify and undo the very logic of their creation.
The “S&P 495” has largely gone nowhere for the past 5 years.
The basic tenet of risk control is diversification. Yet, how diversified are you really when 5 companies represent nearly a quarter of the index, or put another way, represent 105 companies if they were equally weighted.

The very thing that has caused the index to outperform is what will likely prove its undoing.
Takeaway
“Those who do not learn history are doomed to repeat it”
–George Santayana
We’ve seen this all before and so there is no excuse for us not to make a lot of money by positioning correctly for what’s coming.
To be clear, I do believe that to be commodities and in particular, energy as you’ve probably guessed from my previous posts on uranium and oil.
Cheers,
Ferg